Introduction
CrashMap Pro is an enhanced version of the popular www.crashmap.co.uk website. This User Guide has been created to guide you through the system currently in development, and we welcome your feedback.
Navigating the map
The CrashMap Pro Web Map consists of a full page map with a series of buttons along the top banner and in the top right corner of the map, which we will look at in more detail in the following sections of the guide.

Navigating this map is intuitive. To change the zoom of the map, click the ![]() and
and ![]() buttons in the top left corner. To change the extent (the portion of the map visible on the screen), either click and drag the map. The map can be made full screen using the
buttons in the top left corner. To change the extent (the portion of the map visible on the screen), either click and drag the map. The map can be made full screen using the ![]() button, which can then be undone by pressing the
button, which can then be undone by pressing the ![]() button.
button.
There is also a search bar in the top left corner of the map to search by address.
![]()
Finally, in the bottom left corner the scale of the map is visible.
![]()
On the right of the banner at the top of the Web Map there are eight icons: ![]()
Each of these will open a different window on the right of the screen. Clicking the ![]() button in the banner at the top of each window will collapse the window to the banner, and the
button in the banner at the top of each window will collapse the window to the banner, and the ![]() button will expand it again. The
button will expand it again. The ![]() button will close the window. Note that only one of these windows can be open at any time.
button will close the window. Note that only one of these windows can be open at any time.


Selecting the first ‘Legend’ icon ![]() displays the legend of the map. The second ‘Filter’ icon
displays the legend of the map. The second ‘Filter’ icon ![]() opens the filters window, which will be explained in the subsequent filters section. The third ‘Measurement’ icon
opens the filters window, which will be explained in the subsequent filters section. The third ‘Measurement’ icon ![]() opens the measurement window, which will be explained in the measurements section. Selecting the fourth ‘Basemap Gallery’ icon
opens the measurement window, which will be explained in the measurements section. Selecting the fourth ‘Basemap Gallery’ icon ![]() allows the user to change the underlying basemap. There is a selection of OS maps to choose from with various colour schemes and labelling.
allows the user to change the underlying basemap. There is a selection of OS maps to choose from with various colour schemes and labelling.
The fifth ‘Layer List’ icon ![]() opens the Layer List window, which will be explained in the Layers section.
opens the Layer List window, which will be explained in the Layers section.

The sixth ‘bookmarks’ icon ![]() opens the Bookmarks window. This allows you to name and save the current map extent and return to it later. You can add
opens the Bookmarks window. This allows you to name and save the current map extent and return to it later. You can add ![]() , edit bookmark name
, edit bookmark name ![]() and delete
and delete ![]() existing bookmarks. (Please note: Bookmarks are saved in the web browser’s cache. They will be removed if you clear the browser cache).
existing bookmarks. (Please note: Bookmarks are saved in the web browser’s cache. They will be removed if you clear the browser cache).
The seventh ‘About’ icon ![]() opens the About window that provides information about CrashMap, including data sources.
opens the About window that provides information about CrashMap, including data sources.
The final icon ![]() gives the option to print the map. The layout and format of the print are selected using the dropdowns. The ‘Advanced’ button allows the user to manually set the scale, extent, scale bar units, height, width and quality of the print. Each print appears listed in the pop-up window. Clicking on these opens the print in a new browser tab. The list of prints can be cleared by clicking the ‘Clear prints’ button.
gives the option to print the map. The layout and format of the print are selected using the dropdowns. The ‘Advanced’ button allows the user to manually set the scale, extent, scale bar units, height, width and quality of the print. Each print appears listed in the pop-up window. Clicking on these opens the print in a new browser tab. The list of prints can be cleared by clicking the ‘Clear prints’ button.


Filters
On the right of the banner at the top of the map is the ‘Filters’ icon which opens the Filter widget window. Each of these filters are turned on or off using the switches ![]() to the right. The filters allow the user to filter crashes by year, severity, Highway Authority, the involvement of different road user types and the involvement of certain casualty types. When multiple filters are on, only crashes satisfying all conditions are shown. Each filter can be collapsed or expanded using the
to the right. The filters allow the user to filter crashes by year, severity, Highway Authority, the involvement of different road user types and the involvement of certain casualty types. When multiple filters are on, only crashes satisfying all conditions are shown. Each filter can be collapsed or expanded using the ![]() and
and ![]() buttons on the edge of the left, and the entire pop-up window can be collapsed, expanded or closed using the
buttons on the edge of the left, and the entire pop-up window can be collapsed, expanded or closed using the ![]() ,
, ![]() and
and ![]() buttons.
buttons. 
Layers
Selecting the ‘Layer List’ icon in the top right corner will open the list of available layers (‘CrashMap’ and ‘Labels’) and tables (‘Vehicles’ and ‘Casualties’).

The ‘CrashMap’ layer shows crashes coloured by severity. It is overlaid on the basemap, and can be removed or added to the map by deselecting or selecting the tick box ![]() to the left of ‘CrashMap’. Clicking on ‘CrashMap’ will display/hide the legend for the layer. This legend is also visible in the ‘Legend’ window when the layer is made visible.
to the left of ‘CrashMap’. Clicking on ‘CrashMap’ will display/hide the legend for the layer. This legend is also visible in the ‘Legend’ window when the layer is made visible.

The ‘Labels’ layer labels each crash with its Accident ID
Clicking the ![]() button gives the user the option to turn all layers on/off or to expand/collapse the legends of all layers.
button gives the user the option to turn all layers on/off or to expand/collapse the legends of all layers.
Clicking the ![]() icons to the right of each label give the user further options for the layer and tables.
icons to the right of each label give the user further options for the layer and tables.
The ‘Zoom to’ option will change the zoom of the map to show the entire layer within the extent. The ‘Transparency’ option allows the user to adjust the transparency of the layer.


The ‘Disable pop-up’ option, which is replaced with an ‘Enable pop-up’ option when selected, toggles whether or not a pop-up showing data appears when selecting an object within the later. This will be covered more in the following Viewing Collision Data section. The ‘View in Attribute Table’ option adds the data from the layer to the set of attribute tables that appear at the bottom of the screen. These attribute tables will also be discussed further in the following section. Finally, the ‘Show item details’ option will open a new tab in the browser showing the layer or table, and information about the layer or table, in ArcGIS Online.
Measurement
Selecting the ‘Measurements’ icon in the top right corner will open the Measurements window. To begin measuring, click the ‘Distance’ button ![]() and select the units from the adjacent drop-down list. Clicking consecutively on the map will add a series of green markers
and select the units from the adjacent drop-down list. Clicking consecutively on the map will add a series of green markers ![]() to the map, between which distances are measured. To place the final green marker, double click on the map. The total distance will then display in the measurements window. To clear the previous green markers, click the ‘Clear’ button
to the map, between which distances are measured. To place the final green marker, double click on the map. The total distance will then display in the measurements window. To clear the previous green markers, click the ‘Clear’ button ![]() . To reset the measuring tool, toggle the ‘Distance’ button
. To reset the measuring tool, toggle the ‘Distance’ button ![]() on and off.
on and off.

Selecting, Viewing and Extracting Collision Data
When a collision in the CrashMap layer is clicked on a pop-up window appears. The pop-up window can also be maximised using the ‘Maximise’ button ![]() , returned to normal size using the ‘Restore’
, returned to normal size using the ‘Restore’ ![]() , and closed using the ‘Close’ button
, and closed using the ‘Close’ button ![]() . The ‘Zoom to’ button
. The ‘Zoom to’ button ![]() changes the zoom of the map to focus on the crash. Clicking the
changes the zoom of the map to focus on the crash. Clicking the ![]() button gives three additional options: ‘Pan to’
button gives three additional options: ‘Pan to’ ![]() will change the extent of the map to centre around the crash; ‘Add a marker’
will change the extent of the map to centre around the crash; ‘Add a marker’ ![]() will add a blue marker to the map at the chose crash, which will remain visible when printed; ‘View in Attribute Table’
will add a blue marker to the map at the chose crash, which will remain visible when printed; ‘View in Attribute Table’ ![]() will show the crash as a single record in the attribute table. Clicking on a blue marker will show its co-ordinates in a dropdown box, and clicking on the
will show the crash as a single record in the attribute table. Clicking on a blue marker will show its co-ordinates in a dropdown box, and clicking on the ![]() button will give the option to pan to the marker or remove the marker.
button will give the option to pan to the marker or remove the marker.


This window lists all the data available for the selected collision, including the severity, the number of vehicles and the number of casualties. At the bottom of this list of data, next to ‘Web_Link’, is a link to CrashMap to download the full report on this collision.
Below the data are links to related tables. Clicking one of these will take you to the data on either the vehicles or casualties related to the collision. Clicking the back button ![]() in the top right corner of the popup window will bring back the collision data.
in the top right corner of the popup window will bring back the collision data.

To view data on multiple items in the CrashMap layer, clicking the ‘Open Attribute Table’ button ![]() at the bottom of the map opens the available attribute tables. These collect together all the available data for the crashes within the extent. To view all crashes in the attribute table, regardless of extent, deselect the ‘Filter by map extent’ button
at the bottom of the map opens the available attribute tables. These collect together all the available data for the crashes within the extent. To view all crashes in the attribute table, regardless of extent, deselect the ‘Filter by map extent’ button ![]() .
.

Records in the attribute table can be selected by clicking on them. Selected records are highlighted blue. To select multiple records, hold down Ctrl/Command on the keyboard. Records can also be selected using the map, as explained later in this section. The ‘Clear selection’ button ![]() will clear the selected records. The ‘Zoom to’ button
will clear the selected records. The ‘Zoom to’ button ![]() changed the extent of the map to include all of the selected records. The ‘Options’ dropdown menu
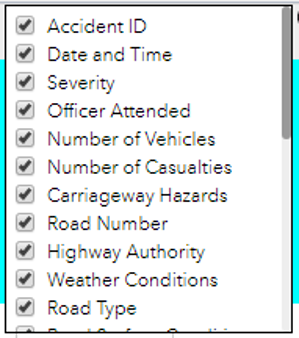
changed the extent of the map to include all of the selected records. The ‘Options’ dropdown menu ![]() reveals an additional five buttons: ‘Show selected records’ reduces the attribute table to just the selected records; ‘Show related records’ opens attribute tables showing the ‘Casualties’ and ‘Vehicles’ related to the selected records; ‘Filter’ allows the user to filter records in a way similar to building a custom filter as described later in the Filters section; ‘Show/Hide columns’ opens a list of field names, which can be selected or deselected; ‘Export selected to CSV’ exports the selected records to a CSV file. These options are also available in the ‘Casualties’ and ‘Vehicles’ tables, which can alternatively be opened using the ‘View in Attribute Table’ option for the layer in the ‘Layer List’ window. To collapse the attribute tables, click the ‘Hide Attribute Table’ button
reveals an additional five buttons: ‘Show selected records’ reduces the attribute table to just the selected records; ‘Show related records’ opens attribute tables showing the ‘Casualties’ and ‘Vehicles’ related to the selected records; ‘Filter’ allows the user to filter records in a way similar to building a custom filter as described later in the Filters section; ‘Show/Hide columns’ opens a list of field names, which can be selected or deselected; ‘Export selected to CSV’ exports the selected records to a CSV file. These options are also available in the ‘Casualties’ and ‘Vehicles’ tables, which can alternatively be opened using the ‘View in Attribute Table’ option for the layer in the ‘Layer List’ window. To collapse the attribute tables, click the ‘Hide Attribute Table’ button ![]() .
.

Crashes in the CrashMap layer can also be selected using the map.
The ‘Select Crashes’ widget in the top left corner of the map opens a pop-up window. The ‘Select’ dropdown gives the user the option to draw a point, rectangle, polygon, circle or lasso and then selects all crashes contained within the drawn shape. The selected crashes are then selected and highlighted in the attribute table at the bottom of the map. The ‘Clear’ button clears the selection.

The ‘Radius Search’ widget allows the user to list all crashes that have occurred within a chosen radius of a point. With the widget pop-up open, clicking the map or using the searchbar will select the centre point, and the radius is set using the sliding bar. Selecting a crash from the resulting list will give further information, including the approximate distance to the centre point as well as information about the crash, the related vehicles and the related casualties.

The ‘Select and Report’ widget allows the user to highlight a region of the map and produce a report on the collisions in the region. The ‘Placename’ tab of the pop-up window highlights the area around a location, found using the search bar, within a chosen radius. The ‘Draw’ tab allows the user to draw a Point ![]() , Polyline
, Polyline ![]() , rectangular Extent
, rectangular Extent ![]() , Polygon
, Polygon ![]() or selection of crashes
or selection of crashes ![]() , and highlights the region within a chosen radius. Clicking the ‘Report’ button
, and highlights the region within a chosen radius. Clicking the ‘Report’ button ![]() produces a report on the highlighted crashes. This shows the area of the highlighted region, and the ‘Zoom to location’ button
produces a report on the highlighted crashes. This shows the area of the highlighted region, and the ‘Zoom to location’ button ![]() can be used to change the extent of the map to cover the region. The list of crashes can be expanded using the
can be used to change the extent of the map to cover the region. The list of crashes can be expanded using the ![]() button, and the ‘Choose attributes to display’ button
button, and the ‘Choose attributes to display’ button ![]() to the right allows the user to select/deselect which fields appear in the report.
to the right allows the user to select/deselect which fields appear in the report.


The measurement units of the report can be changed using the ‘Choose units for analysis’ button ![]() , and the report can be downloaded as a CSV using the ‘Download’ button
, and the report can be downloaded as a CSV using the ‘Download’ button ![]() or printed using the ‘Print’ button
or printed using the ‘Print’ button ![]() . Selecting print will open the report in a new browser tab, and includes comments box to allow the user to add text to the report before printing.
. Selecting print will open the report in a new browser tab, and includes comments box to allow the user to add text to the report before printing.
